Oriented Bedrock Samples Drilled by the Perseverance Rover on Mars
Benjamin P. Weiss and Elias N. Mansbach contributed equally to this work.
Abstract
A key objective of the Perseverance rover mission is to acquire samples of Martian rocks for future return to Earth. Eventual laboratory analyses of these samples would address key questions about the evolution of the Martian climate, interior, and habitability. Many such investigations would benefit greatly from samples of Martian bedrock that are oriented in absolute Martian geographic coordinates. However, the Mars 2020 mission was designed without a requirement for orienting the samples. Here we describe a methodology that we developed for orienting rover drill cores in the Martian geographic frame and its application to Perseverance's first 20 rock samples. To orient the cores, three angles were measured: the azimuth and hade of the core pointing vector (i.e., vector oriented along the core axis) and the core roll (i.e., the solid body angle of rotation around the pointing vector). We estimated the core pointing vector from the attitude of the rover's Coring Drill during drilling. To orient the core roll, we used oriented images of asymmetric markings on the bedrock surface acquired with the rover's Wide Angle Topographic Sensor for Operations and eNgineering (WATSON) camera. For most samples, these markings were in the form of natural features on the outcrop, while for four samples they were artificial ablation pits produced by the rover's SuperCam laser. These cores are the first geographically-oriented (<2.7° 3σ total uncertainty) bedrock samples from another planetary body. This will enable a diversity of paleomagnetic, sedimentological, igneous, tectonic, and astrobiological studies on the returned samples.
Key Points
-
The Perseverance rover has acquired drill cores of Martian igneous and sedimentary bedrock for future potential return to Earth
-
Using rover engineering data, we have oriented all rock cores in Martian geographic coordinates to better than 2.7° uncertainty
-
Orientation enables future studies of the paleodirections associated with Martian magmatic, sedimentary, tectonic, and magnetic processes
Plain Language Summary
The central goal of the Perseverance rover is to drill rock samples that can be brought back to Earth. Future laboratory studies of these samples could tell us about the history of Mars' climate, its interior structure and whether it was once habitable. These studies would greatly benefit from information about how the rock samples were oriented relative to Martian geographic coordinates. Here we show how we developed a technique to orient cores drilled by the rover and applied it to Perseverance's first 20 rock samples. Like all methods for orienting three-dimensional objects, this required measuring three angles which are analogous to the pitch, yaw, and roll of a boat. We measured the the first two angles using the known orientation of the rover arm during drilling. We measured the third angle using rover photographs of markings on the rock face prior to drilling. These markings were either natural features on the outcrop or, for rock faces with no clear natural markings, an artificial L-shaped pattern of pits produced by the rover's laser. These cores are the first geographically-oriented samples of bedrock from another planet. This will enable a diversity of geological, geophysical, and paleontological studies on the samples in Earth laboratories.
1 Introduction
1.1 Mars 2020 and the Opportunity for Core Orientation
The Perseverance rover is currently exploring Jezero crater to search for signs of past life and characterize the climate and geology of ancient Mars. Jezero is a 45-km diameter complex impact crater situated in the Nili Planum region that formed sometime during the Early Noachian to Late Noachian (e.g., Holm-Alwmark et al., 2021). The original crater floor was covered by igneous rocks interpreted to be volcanic and/or intrusive (Farley et al., 2022) followed by clastic sedimentary materials interpreted to be fluvio-deltaic in origin (Mangold et al., 2021). The Mars 2020 mission's central objective is to drill, document and cache approximately 30 rock and regolith samples that could be returned to Earth for future laboratory studies (Farley et al., 2020). Thus far, the rover has explored the crater floor, fan front, upper fan, and crater margin and collected 20 cores of igneous and sedimentary rocks.
Unlike Martian meteorites, the rocks sampled by the rover have geologic and stratigraphic contexts that constrain their formation and evolution. Furthermore, unlike meteorites and nearly all returned samples from the Moon and asteroids, 18 of the 20 rock cores collected thus far are samples of unambiguous in situ bedrock (i.e., solid rock that underlies the regolith). If the orientations of the cores can be estimated relative to Martian geographic coordinates, this would enable their records of geologic and geophysical processes to be oriented relative to Martian geographic coordinates at the time the rocks crystallized, emplaced and/or were altered.
Oriented samples provide the foundation for paleomagnetic studies, which seek to determine the direction and intensity of natural remanent magnetization. In particular, oriented bedrock samples would enable the first measurements of the paleodirection of another planetary body's past magnetic field. These could be used to test the hypothesis that the waning of an early Martian dynamo led to atmospheric loss on Mars (Gunell et al., 2018; Jakosky & Phillips, 2001; Mittelholz et al., 2018). Such studies rely on an understanding of when a rock acquired its paleomagnetic records. This can be powerfully constrained using field tests that measure the relative orientations of magnetization directions of samples of conglomerate clasts and folded and tilted rocks (Butler, 1992; Tauxe, 2018). Because the orientation of a dipolar magnetic field varies systematically with latitude, the field paleodirection could also be used to establish whether Mars experienced true polar wander (Perron et al., 2007; Thomas et al., 2018) and/or plate tectonics (Connerney et al., 2005; Golombek & Phillips, 2010) and constrain regional tectonic processes. Paleodirectional data could additionally be used to study the secular variation of the dynamo and search for geomagnetic reversals (Merrill et al., 1998), thereby constraining the evolution of Mars' interior and potentially developing a magnetostratigraphic timescale.
Magnetic analyses of oriented samples may also enable the identification and interpretation of secondary remagnetization processes in a way that would be difficult to do for unoriented samples. Examples include the interpretation of magnetizations associated with lightning strikes (Carporzen et al., 2012; Verrier & Rochette, 2002), the measurement of emplacement temperatures of volcanoclastic rocks by analyzing unidirectional thermally induced magnetization overprints after deposition (Lerner et al., 2022), the timing of formation of pigmentary hematite (Swanson-Hysell et al., 2019), and the timing of diagenetic alteration (Heij & Elmore, 2020). Experience with terrestrial rocks has shown that essentially all of the above paleomagnetic investigations can be achieved with samples whose orientations are estimated with uncertainties ∼3° (Tauxe, 2018).
Oriented samples could also be used for sedimentological, volcanological, and structural geological studies. The orientations of petrofabrics such as ripples and crossbedding in sedimentary rocks (Tucker, 2001) and crystal orientations in igneous rocks could constrain the direction of the flows that produced these rocks (e.g., Geoffroy et al., 2002). Crystal orientations can also provide information about the paleohorizontal direction during diagenesis (Tucker, 2001). The orientation of gradients in clastic sedimentary grain sizes can indicate changes in flow rates (Tucker, 2001), while the orientations of gradients in crystal sizes, vesicle sizes, and vesicularity reflect the relative locations of cooling surfaces (e.g., lava flowtops) (e.g., Cashman & Kauahikaua, 1997; Potter et al., 2019). The orientation of textures in sedimentary rocks and, in particular, the slope of their layers relative to paleohorizontal can even be indicators of biogenicity. For example, microbially-stabilized layers in stromatolites can be steeper than the angle of repose for loose sediment, while different biological and abiotic growth processes also contribute to the orientation and tilt of stromatolitic columns (Allwood et al., 2018; Bosak et al., 2013; Donaldson, 1976; Hoffman, 1976; Logan, 1961; Petroff et al., 2013). Finally, the orientations of microfractures, twinning, and deformation lamellae can constrain the stress and strain history of the rocks (e.g., from impacts and endogenic tectonic processes) (Ramsay & Huber, 1983). Again, orientation uncertainties of a few degrees are sufficient to achieve many of these investigations on Earth.
Despite the great value of oriented bedrock samples, neither obtaining information about the orientations of the samples nor the acquisition of samples of bedrock are requirements for the Mars 2020 mission. As a result, the development of techniques for orienting cores had not been planned by the time of launch. Following landing, we addressed this gap through discussions within Mars 2020 science working groups (e.g., the Returned Sample Science Working Group), instrument teams (Wide Angle Topographic Sensor for Operations and eNgineering [WATSON] and SuperCam), team-wide Science Discussions, and deliberations amongst the rover engineers, Long Term Planners, and the Mars 2020 Project Science office. Our collective efforts led to a recognition of the value of oriented samples, prioritization of bedrock samples over float rocks, and a directive to develop methods for orienting the cores. Here we describe a method that we developed for orienting Perseverance rock cores and its application to the first 20 rock cores drilled with the rover. Fundamentally, the method uses the rover's precise knowledge of the orientation of its Drill and WATSON camera during and after the drilling to constrain the orientation of the cores. We show how, with this information, we have oriented all rock cores drilled thus far to better than 2.7° (3σ) total uncertainty.
1.2 History of Acquiring Planetary Samples
Rock samples have been acquired by humans and robotic missions from the surfaces of the Earth, the Moon, three asteroids, and a comet. On the Moon, Apollo samples were acquired as single rocks, soil samples, and chips of boulders broken off with hammers (Heiken et al., 1991). Essentially all samples and parent boulders were float rather than bedrock with the exception of the regolith breccia 70019, which sampled the glass melt lining a <7 million-year-old crater (Schmitt et al., 2017), and possibly also mare basalt samples 15595 and 15596 that were chipped off a boulder outcropping from flows exposed on the edge of Hadley Rille (Lofgren et al., 1975). Some of the larger (≳10 cm) rock samples were oriented in lunar geographic coordinates using astronaut photographs taken with an optical camera (Kammerer & Zeiss, 1972) and a gnomon for measuring shadow angles to determine geographic north (Allton, 1989). Because the local horizontal was not marked on the samples, their orientations were reproduced after return to Earth by illuminating them under simulated lighting conditions like that during sampling (e.g., Nichols et al., 2021; Wolfe et al., 1981).
The Luna 24 (Florensky et al., 1977) and Chang'e-5 (Li et al., 2021) missions each returned unoriented regolith. The Stardust mission returned unoriented dust particles from comet 81/Wild2 (Brownlee et al., 2006), while Hayabusa 1 and 2 and the Origins-Spectral Interpretation-Resource Identification-Security-Regolith Explorer (OSIRIS-REx) missions returned unoriented regolith from asteroids (25143) Itokawa (Nakamura et al., 2011), (162173) Ryugu (Yada et al., 2022), and (101955) Bennu (Lauretta et al., 2021), respectively. In summary, other than Apollo sample 70019, no samples returned from bodies other than Earth are unambiguous bedrock samples. As a result, other than for 70019, the orientations of all samples at the time they formed relative to planetary geographic coordinates are unknown.
In contrast, countless oriented samples of bedrock have been acquired on Earth. Such samples have been acquired in three main ways. First, near-surface (≲20 cm deep) core samples are commonly acquired using a handheld diamond tipped rotary drill (for hard rock) or with non-rotary drive coring devices (for soft sediments) (Tauxe, 2018; Turner et al., 2015). These are oriented using a sun compass, magnetic compass, and/or a global navigation satellite system and can have uncertainties as low as ±3° (Cañón-Tapia, 2007; Fukuma & Muramatsu, 2022; Tauxe, 2018). Second, block samples can be chipped off bedrock and typically oriented with a sun compass and/or magnetic compass with uncertainties that can approach those typically achieved with hand held drills (Collinson, 1983). Third, deeper drill cores ranging up to several km in length are acquired with mechanized drill rigs and can be fully oriented using continuous scribing with an oriented core barrel (Davison & Haszeldine, 1984), spatial correlation of natural features in the core with either oriented borehole images and/or regionally extensive geologic structures (Davison & Haszeldine, 1984; Paulsen et al., 2002), and/or correlation of the direction of natural remanent magnetization in the core with present geographic north (Sugimoto et al., 2020). These methods can have uncertainties as low as ±10° (Davison & Haszeldine, 1984; Nelson et al., 1987).
1.3 Cores Drilled by Perseverance
The Mars 2020 mission is acquiring the first extensive sample suite from another planet (Figure 1). Perseverance has thus far acquired 23 samples from 15 different workspaces (Farley & Stack, 2022, 2023; Simon et al., 2023) (Table 1). Of these 23 attempts, 21 were cores drilled from solid rock targets and 2 of regolith. Of the 21 rock coring attempts, 20 were successful; the first coring attempt (Roubion) sampled only the atmosphere and possibly a few unoriented grains because the rock crumbled. Of the 20 successful rock cores, 18 were acquired from in situ bedrock: 6 samples taken from igneous rocks (likely volcanic and olivine-rich cumulates of broadly basaltic composition) and the remaining 12 from sedimentary rocks (siltstones and sandstones with either bulk basaltic or sulfate-rich compositions) (Table 1). The remaining 2 cores (Montdenier and Montagnac) were acquired from a ∼40-cm diameter tabular igneous boulder that was differentially tilted with respect to adjacent bedrock and moved during the course of drilling. Future laboratory measurements on this unique sample suite should collectively enable many of the aforementioned studies of the igneous, sedimentological, tectonic and magnetic evolution of Mars (Section 1.1).
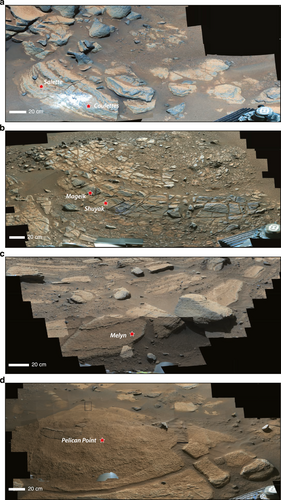
Examples of bedrock outcrops sampled by the Perseverance rover. (a) Brac workspace on crater floor. Center of view looking toward azimuth ∼60° clockwise from north. Locations where Salette and Coulettes cores were subsequently drilled are noted. Part of Mast Camera Zoom (Mastcam-Z) (Bell et al., 2021) mosaic QZCAM_SOL0255_0265_ZCAM08278_ZCAM08283_L0_Z34_BRAC_WORKSPACE_E01. (b) Amalik workspace on fan front. Locations where Mageik and Shuyak cores were subsequently drilled are noted. Center of view looking toward azimuth ∼190° clockwise from north. Part of Mastcam-Z mosaic QZCAM_SOL0569_ZCAM08590_L0_Z110_RASPBERRY_ISLAND_AMALIK_WORKSPACE_E01. (c) Berea workspace on upper fan. Location where Melyn core was subsequently drilled is noted. Center of view looking toward azimuth ∼330° clockwise from north. Part of Mastcam-Z mosaic QZCAM_SOL0736SOL0739_ZCAM08745ZCAM08750_L0R0_Z110_TENBY_WORKSPACE_PDI_EXTENSION_E01. (d) Hans Amundsen Memorial Workspace on crater margin. Location where Pelican Point core was subsequently drilled is noted. Center of view looking toward azimuth ∼270° clockwise from north. Part of QZCAM_SOL0911_SOL0912_SOL0913_SOL0914_SOL0916_ZCAM08918_ZCAM08919_ZCAM08920_ZCAM08921_ZCAM08922_ZCAM08923_R0_Z110_POINT_EDGAR_HANS_AMUNDSEN_MEMORIAL_WORKSPACE_E01. Complete Mastcam-Z mosaics for these images are presented in Figures S1–S4.
| Sample | Workspace | Sol | Lithology | Bedrock? | Hade (°) | Azimuth (°) | Roll (°) |
|---|---|---|---|---|---|---|---|
| Roubiona | Roubion | 164 | Igneousa | Ya | 3.43 ± 0.96 | 208.74 ± 0.96 | 297.10 ± 2.12 |
| Montdenier | Rochette | 190 | Igneous | N | 9.42 ± 0.96 | 219.27 ± 0.96 | 192.99 ± 2.12 |
| Montagnac | Rochette | 196 | Igneous | N | 17.70 ± 0.96 | 225.96 ± 0.96 | 196.86 ± 2.12 |
| Salette | Brac | 262 | Igneous | Y | 17.78 ± 0.96 | 81.51 ± 0.96 | 254.59 ± 2.12 |
| Coulettes | Brac | 271 | Igneous | Y | 14.50 ± 0.96 | 78.68 ± 0.96 | 222.51 ± 2.12 |
| Robine | Issole | 295 | Igneous | Y | 5.36 ± 0.96 | 225.58 ± 0.96 | 236.45 ± 2.12 |
| Malay | Issole | 337 | Igneous | Y | 2.72 ± 0.96 | 77.64 ± 0.96 | 283.05 ± 2.12 |
| Hahonih | Sid | 371 | Igneous | Y | 21.41 ± 0.96 | 73.18 ± 0.96 | 127.00 ± 2.12 |
| Atsah | Sid | 374 | Igneous | Y | 18.02 ± 0.96 | 69.87 ± 0.96 | 111.91 ± 2.12 |
| Swift Run | Skinner Ridge | 490 | Sedimentary | Y | 16.63 ± 0.96 | 355.94 ± 0.96 | 220.71 ± 2.12 |
| Skyland | Skinner Ridge | 495 | Sedimentary | Y | 17.18 ± 0.96 | 4.68 ± 0.96 | 240.38 ± 2.12 |
| Hazeltop | Wildcat Ridge | 509 | Sedimentary | Y | 13.78 ± 0.96 | 3.53 ± 0.96 | 341.30 ± 2.12 |
| Bearwallow | Wildcat Ridge | 516 | Sedimentary | Y | 15.28 ± 0.96 | 358.37 ± 0.96 | 333.17 ± 2.12b |
| Shuyak | Amalik | 575 | Sedimentary | Y | 16.72 ± 0.96 | 219.48 ± 0.96 | 259.41 ± 2.12 |
| Mageik | Amalik | 579 | Sedimentary | Y | 26.11 ± 0.96 | 198.38 ± 0.96 | 91.18 ± 2.12 |
| Kukaklek | Hidden Harbor | 623 | Sedimentary | Y | 6.15 ± 0.96 | 289.36 ± 0.96 | 265.10 ± 2.12 |
| Atmo Mountain | Observation Mountain | 634 | Regolith | N | – | – | – |
| Crosswind Lake | Observation Mountain | 639 | Regolith | N | – | – | – |
| Melyn | Tenby | 749 | Sedimentary | Y | 6.49 ± 0.96 | 258.59 ± 0.96 | 222.44 ± 2.12b |
| Otis Peak | Emerald Lake | 822 | Sedimentary | Y | 4.63 ± 1.00 | 182.83 ± 1.00 | 180.13 ± 2.14 |
| Pilot Mountain | Hague Creek | 882 | Sedimentary | Y | 2.00 ± 0.96 | 262.69 ± 0.96 | 234.21 ± 2.12 |
| Pelican Point | Hans Amundsen Memorial Workspace | 923 | Sedimentary | Y | 1.29 ± 0.96 | 246.80 ± 0.96 | 218.91 ± 2.12b |
| Lefroy Bay | Lake Newell | 942 | Sedimentary | Y | 0.53 ± 0.96 | 55.66 ± 0.96 | 122.08 ± 2.12b |
- Note. The first column lists the sample name, the second column lists the sampling location, the third column lists the sampling sol, the fourth column lists the sample lithology, the fifth column lists whether the sample was acquired from in situ bedrock, and the sixth through eighth columns list the hade, azimuth and roll and upper limits on their 3σ uncertainties. The reported hades and azimuths are taken from the post-coring pre-unloading Front Hazcam Left images. The uncertainties are estimated as discussed in Section 2.6 with a breakdown shown in Table 3.
- a Due to crumbling of the rock during drilling, the sample tube contains the Martian atmosphere and possibly a few unoriented grains of rock.
- b Core top marked with SuperCam laser for roll orientation.
2 Core Orientation Methodology
2.1 Orienting the Core by Orienting the Coring Drill
Mars 2020 samples are acquired with the Coring Drill (referred to hereafter as the Drill), a rotary percussive drilling mechanism at the end of the rover arm (Moeller et al., 2021) (Figure 2). The Drill employs a Coring Bit (a 27-mm outer diameter, 185-mm long stainless steel cylinder coated with titanium nitride and tipped with 4 tungsten carbide teeth) containing an interior Sample Tube. Core samples are typically 13 mm in diameter and 61–81 mm long, such that the typical kerf is 7 mm. The Drill can acquire cores at an angle of up to 10° between the Drill axis (pointing vector) and surface normal and at an angle up to 110° from local gravity (i.e., 20° up from geographic horizontal).
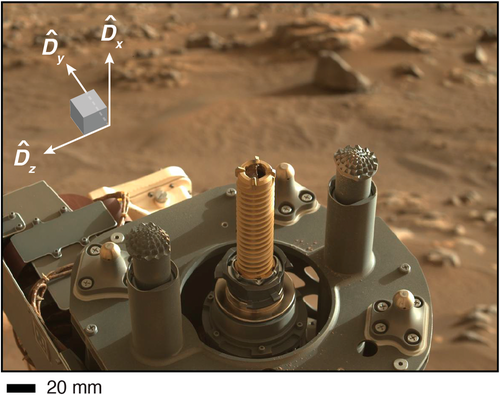
View of Perseverance Drill on sol 371. Shown is Left Mastcam-Z image of Drill with Coring Bit (gold, ribbed cylinder at center) and two adjacent Stabilizers (extendable gray posts with corrugated tips). The orientation of the Drill reference frame (Dx, Dy, Dz), is shown by white arrows, with pointing outwards along the Drill shaft, pointing perpendicular to the plane containing the two Stabilizers toward the Planetary Instrument for X-Ray Lithochemistry (PIXL) instrument (white box at top left), and axis pointing along the axis of the Stabilizers. Image ZL0_0371_0699887107_744EBY_N0110108ZCAM05070_0340LMJ02.
Prior to drilling, the outcrop surface is imaged at high resolution (∼25–30 μm at a typical 6–7 cm standoff distance) using WATSON (Bhartia et al., 2021). The Drill is then placed just above the outcrop face with a lateral horizontal drill uncertainty of typically ±5.4 mm (3σ) but occasionally ±9.4 mm (3σ). Following placement, two Stabilizers on either side of the Coring Bit are pushed into the rock face (this is called preloading) (Figure 3). Then the Coring Bit is advanced progressively into the rock, chiseling out a cylindrical kerf of rock flour (Movies S1–S8). At the completion of drilling, the Stabilizers are unloaded and rotation of the Drill body about an axis offset from the center of the Sample Tube breaks the core with shear pressure. Finally, the Coring Bit, now with the rock sample inside the interior Sample Tube, is extracted from the outcrop. Following imaging of the core's bottom (i.e., inner end) using the Caching System Camera (CacheCam), the sample is cached inside the rover body (Moeller et al., 2021).
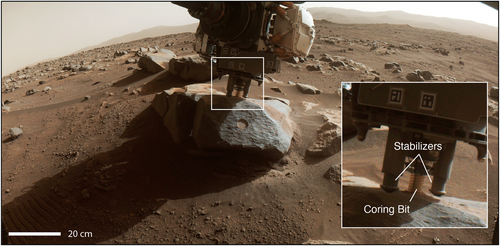
Front Hazcam Left image of Sid rock acquired just after the Atsah sample was drilled (sol 374) and prior to unloading of the stabilizers. The Drill and Stabilizers are labeled, and the Drill is partially extracted from the outcrop. There is a small tailings pile created by the coring activity around the Drill. Image FLF_0374_0700151087_506CWS_N0110108FHAZ00911_0A0195J02.
Because the cylindrical sidewalls of the Coring Bit are essentially parallel to the borehole, we estimate the orientation of the core by orienting the Drill itself. Because the Drill's orientation may change slightly during drilling, we have chosen the orientation of the pointing vector of the Drill just after completion of drilling but before Stabilizer unloading as an indication of the mean orientation of the pointing vector of the core. As we show in Section 3.2, we have found that the orientation angle of the Drill generally varies by ≲0.7° (3σ) during drilling. Therefore, the estimated orientation is not sensitive to the choice of when during the drilling process the Drill orientation is assigned as the core orientation.
2.2 Reference Frames
The process of estimating the core orientation involves six coordinate systems that orient the core relative to the Perseverance rover and Mars (Table 2). Here we define these orientation systems and show how they are interrelated. We focus on the coordinate systems' orientations rather than the locations of their origins since only the former are relevant for core orientation. All the reference frames described here are Cartesian and right-handed. We will use the notation to generically denote a unit vector for a particular Cartesian axis, k = x, y, z, associated with a particular reference frame, A, such that = [1, 0, 0], = [0, 1, 0] and = [0, 0, 1]. To express these vectors in another frame, B, we use with individual components Ak,l,B for the Cartesian axes in another frame B of l = x, y, z.
| Name | Notation | x | y | z |
|---|---|---|---|---|
| Rover Mechanical | −− | Rover forward | Starboard | Rover down |
| Drill | −− | Drill axis away from rover | Perpendicular to axis containing Stabilizers toward PIXL | Along axis containing Stabilizers |
| WATSON | −− | Normal to WATSON image plane toward outcrop | In WATSON image plane toward top of imagea | In WATSON image plane toward right of imagea |
| Geographic | −− | North | Eastb | Downb |
| Site frame i | −− | Estimated north | Estimated eastc | Estimated downc |
| Core | −− | Core axis into outcrop (core pointing vector) | Upward along steepest direction of plane normal to | In Martian horizontal plane |
- Note. The first column lists the coordinate system name and the next three columns define the orientations of the x-, y-, and z-axes. All coordinate systems are right-handed: .
- a The − plane is called the “WATSON plane.”
- b The − plane is called the “Core plane.”
- c The − plane is called the “Site horizontal plane.”
We make use of three reference frames describing the orientation of the rover and two of its subsystems. The Rover Mechanical frame (Rx, Ry, Rz) is fixed with respect to the rover body (Figure 4). Here, points toward rover forward, points toward starboard, and points toward rover down. The Drill reference frame consists of a pointing vector, , pointing along the Drill axis away from the rover body, while points perpendicular to the axis containing the two Stabilizers toward the Planetary Instrument for X-Ray Lithochemistry instrument (Allwood et al., 2020), and points along the axis of the Stabilizers (Figures 2 and 4). Likewise, the rover's WATSON frame (Wx, Wy, Wz) consists of a vector, , pointing into the image plane toward the outcrop (Figure 4) with pointing in the plane of the image toward the top of the image, and pointing in the plane of the image toward the right. We refer to the image plane − as the “WATSON plane.”
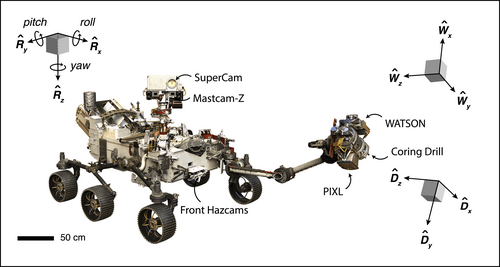
Rover Mechanical, Wide Angle Topographic Sensor for Operations and eNgineering (WATSON), and Drill coordinate systems for Perseverance rover. Shown is a drawing of the rover with orientations of the three coordinate systems. For the Rover Mechanical system (Rx, Ry, Rz), points forward, points to starboard, and points down. For the WATSON system (Wx, Wy, Wz), points perpendicularly out of the image plane, points to the top of the image plane and , points toward the right of the image plane (see Figures 6–8 and 11–13). For the Drill frame (Dx, Dy, Dz), points along the drill shaft, points perpendicular to the axis containing the two Stabilizers toward the Planetary Instrument for X-Ray Lithochemistry (PIXL) instrument, and axis points along the axis of the Stabilizers. PIXL, the Coring Drill, Front Hazcams, SuperCam and Mastcam-Z are labeled.
Two reference frames specify the rover's orientation with respect to Mars. First, the Martian Geographic frame (Gx, Gy, Gz) (Figure 5) is a fixed frame independent of the rover position and orientation. Martian north (N) lies along , east (E) along , and nadir (down [D]) lies along . North points toward Mars' rotation pole, east lies in Mars' mean equatorial plane, and nadir points toward Mars' center of mass (Archinal et al., 2018).
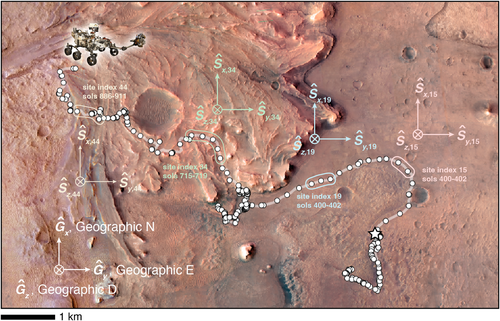
Geographic and Site coordinate systems for Perseverance rover. High Resolution Imaging Science Experiment (HiRISE) image of Jezero crater showing the rover traverse for the first 960 sols on Mars. White dots denote positions where the rover was localized at different times (which usually occurs at the end of a drive but sometimes also during mid-drive imaging). The position of rover on sol 960 is denoted by the rover icon and the Olivia E. Butler Landing site is denoted by the white star. The orientation of the Martian geographic frame is shown at lower left, with pointing toward Martian north (N) and pointing toward Martian east (E) and pointing down (D). Three example Site frames and associated sols are denoted for Site Index 15 (pink), Site Index 19 (blue), Site Index 34 (green), and Site Index 44 (tan). The axes of each Site frame are oriented to within 1° of the equivalent axes in the Geographic frame.
Second, the Site frames (Sx,i, Sy,i, Sz,i) are a collection of i frames fixed with respect to the local surface at various locations visited by the rover, each of which are estimates of the Martian Geographic frame (Deen, 2022) (Figure 5). Martian north is estimated to lie along , east is estimated to lie along , and nadir (down) lies along . While driving, the rover uses its gyroscopes to estimate the three angles quantifying its orientation: roll (right handed rotation angle about ), pitch (right handed rotation angle about ), and yaw (right handed angle about ). Because the rover accumulates uncertainty in its estimated orientation as it drives, the uncertainty estimation of the Geographic frame grows with time (Deen, 2022). This eventually necessitates a “Surface Attitude Positioning and Pointing Operations (SAPP) update” in which the rover obtains a new, more precise estimate of its orientation. The SAPP update process uses rover accelerometers to estimate the roll and pitch, gyroscopes to estimate the yaw and, occasionally, additional observations of the position of the Sun (a “sunID update”) to obtain the most accurate estimate of the yaw (Ali et al., 2005; Trautman et al., 2022) (see Figure 4). Some of these SAPP updates are associated with an increase of the Site Index, i, which redefines the position and orientation of the Site frame actively being used by the rover. Unless otherwise stated, we will not distinguish between the Martian Geographic and various Site frames in the rest of this manuscript and we will drop the Site frame subscript, i. We will use the terms “Site horizontal” to denote the - planes and “Site down” and “Site up” to denote the axial directions parallel and antiparallel, respectively, to (Figure 6).
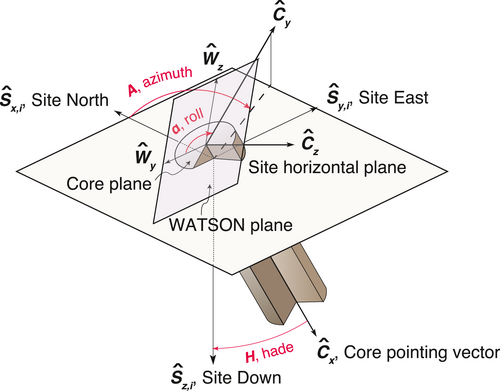
Coordinate systems for cores collected by the Perseverance rover. Shaded cylinder is core with cutaway view in lower right quadrant. Martian geographic east, north, and down are approximated by the Site axes, , , and , respectively. The pointing vector, , points into outcrop and is normal to the Core plane (−), points upward along the steepest direction of the plane normal to (i.e., the − lies in the Site vertical plane) and lies in the Site horizontal plane, completing the triad. The azimuth, A, is the clockwise angle from geographic north of the projection of onto the Site horizontal plane (−). The hade, H, is the angle of from vertical. The core roll, α, is defined as the clockwise angle from Wide Angle Topographic Sensor for Operations and eNgineering (WATSON) pre-coring image y-axis onto the Core plane, , to the projection of the Core y-axis into the WATSON plane, . In this example, the WATSON and Core planes are nearly coplanar, such that . Adapted from Butler (1992).
Finally, we define the core frame as having pointing along the core into the outcrop, pointing upward along the steepest direction of the plane normal to (i.e., − lies in the Site vertical plane), and lying in the Martian geographic horizontal plane, completing the triad (Figure 6). We refer to the − plane as the “Core plane,” which may be canted with respect to the outcrop surface and with respect to the WATSON plan. is to high accuracy (<0.1°) aligned with (see end of Section 2.1), but and can be at large angles with respect to, and , respectively.
2.3 Geometric Quantities Defining Core Orientation
The orientation of a solid body in three-dimensional space can be parameterized with an axis-angle representation consisting of a unit vector indicating the direction of an axis of rotation and an angle prescribing the magnitude of a rotation around this axis (Amirouche, 2006). Because the unit vector is itself described by two angles, three angles are necessary in total to describe a body's orientation. For Perseverance core orientation, the relevant unit vector is the core's pointing vector, , whose direction is quantified by the hade, H, and azimuth, A (Butler, 1992), while the rotation around this axis is quantified by the roll, α (Figure 6). Note that this core roll is distinct from the rover body roll mentioned above.
2.4 Quaternions
2.5 Procedures for Estimating Core Orientation
2.5.1 Determining the Hade and Azimuth
From Equation 1, the hade is a function of the core pointing vector and Site down, From Equation 2, the azimuth depends on the projection of the core pointing vector onto the Site horizontal plane, , and Site north, .
2.5.2 Determining the Roll
Estimation of the roll requires determining the rotational spin of the core relative to a fiducial direction. This angle cannot be estimated using rover Drill metadata because the core rotates in an unknown way with respect to the sample tube and core body. Instead, we use images of the outcrop prior to drilling taken with WATSON (Figures 7-10). These images can be registered with respect to the core top using rotationally asymmetric features on the outcrop location where the core is drilled and knowledge of the orientation of the WATSON frame at the time of imaging, tW. Again, we use the Drill orientation as a proxy for the core orientation.
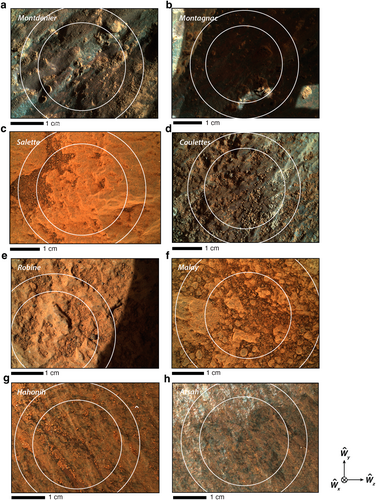
Wide Angle Topographic Sensor for Operations and eNgineering (WATSON) images of drilling targets on the Jezero crater floor with locations of cores noted. (a) Montdenier target (imaged on sol 188). WATSON image SIF_0188_0683643364_351FDR_N0070000SRLC00678_0000LMJ01. (b) Montagnac (imaged on sol 195). WATSON image SIF_0195_0684255577_390FDR_N0070000SRLC00701_0000LMJ01. (c) Salette (imaged on sol 257). WATSON image SIF_0257_0689756802_085FDR_N0080000SRLC00654_0000LUJ01. (d) Coulettes (imaged on sol 267). WATSON image SIF_0267_0690661712_886FDR_N0080000SRLC00701_0000LMJ01. (e) Robine (imaged on sol 293). WATSON image SIF_0293_0692957683_398FDR_N0090000SRLC00643_0000LMJ02. (f) Malay (imaged on sol 337). WATSON image SIF_0337_0696859111_167FDR_N0090276SRLC00636_0000LMJ01. (g) Hahonih (imaged on sol 370). WATSON image SIF_0370_0699795188_894RAS_N0110108SRLC00663_0000LMJ01. (h) Atsah (imaged on sol 373). WATSON image SIF_0373_0700065505_402RAS_N0110108SRLC00657_0000LMJ01. Compass shows orientation of WATSON coordinate frame (Wx, Wy, Wz). Inner white circles denote the nominal locations of the 27-mm outer diameter of the Coring Bit during drilling. Outer white circles denote the nominal locations of the outer diameter of the Coring Bit plus twice the 3σ lateral drill placement uncertainty; The latter is typically radially ±5.4 mm as in (a)–(e), (g)–(h) but occasionally ±9.4 mm as in (f), giving a total diameter of 37.8 mm or 45.8 mm, respectively. Natural surface markings useable for roll orientation (e.g., radially asymmetric markings, bumps, and depressions) are visible in all images.
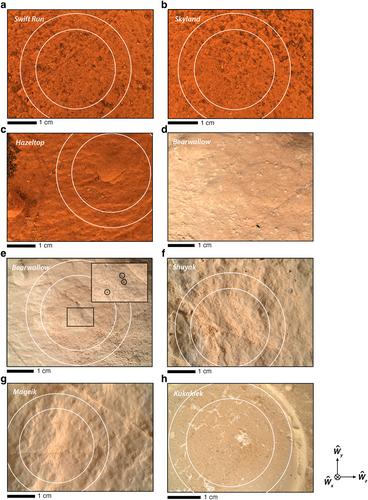
Wide Angle Topographic Sensor for Operations and eNgineering (WATSON) images of drilling targets on the Jezero fan front with locations of cores noted. (a) Swift Run (imaged on sol 485). WATSON image SIF_0485_0709994755_121FDR_N0261004SRLC00730_0000LMJ01. (b) Skyland (imaged on sol 485). WATSON image SIF_0485_0709996024_867FDR_N0261004SRLC00730_0000LMJ01. (c) Hazeltop (imaged on sol 505). WATSON image SIF_0505_0711773216_015RAS_N0261222SRLC00730_0000LMJ01. (d) Bearwallow natural surface (imaged on sol 505). Portion of WATSON image SIF_0505_0711774832_328FDR_N0261222SRLC04001_0000LMJ01. (e) Bearwallow after marking with an L-shaped pattern of three pits using the SuperCam laser (sol 511). Box shows location of inset. Each laser pit is circled in the inset. WATSON image SIF_0511_0712314955_726FDR_N0261222SRLC00773_0000LMJ01. (f) Shuyak (imaged on sol 570). WATSON image SIF_0570_0717551784_765FDR_N0290000SRLC00750_0000LMJ01. (g) Mageik (imaged on sol 577). WATSON image SIF_0577_0718170754_562FDR_N0290000SRLC00701_0000LMJ01. (h) Kukaklek (imaged on sol 614). WATSON image SIF_0614_0721455441_734FDR_N0301172SRLC00643_0000LMJ01. Compass shows orientation of WATSON coordinate frame (Wx, Wy, Wz). Inner white circles denote the nominal locations of the 27-mm outer diameter of the Coring Bit during drilling. Outer white circles denote the nominal locations of the outer diameter of the Coring Bit plus twice the 3σ lateral drill placement uncertainty. Fore these cores the latter is ±5.4 mm radially as shown in (a)–(c), (e)–(h). Natural surface markings useable for roll orientation (e.g., radially asymmetric markings, bumps and depressions) are visible for all targets except Bearwallow (d, e).
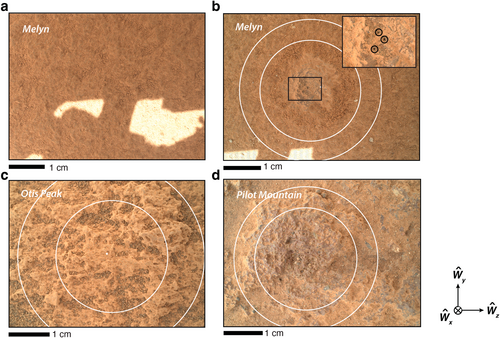
Wide Angle Topographic Sensor for Operations and eNgineering (WATSON) images of drilling targets on the Jezero upper fan with locations of cores noted. (a) Melyn natural surface (imaged on sol 741). The bedrock is almost completely obscured by a layer of fine dust. WATSON image SIF_0741_0732728692_480RAS_N0370000SRLC00701_0000LMJ01. (b) Melyn after marking with an L-shaped pattern of three pits using the SuperCam laser (sol 747). Box shows location of inset. Each laser pit is circled in the inset. WATSON image SIF_0747_0733259668_218FDR_N0370000SRLC00748_0000LMJ01. (c) Otis Peak (imaged on sol 822). WATSON image SIF_0822_0739913201_500FDR_N0400132SRLC00660_0000LMJ0. (d) Pilot Mountain (imaged on sol 879). WATSON image SIF_0879_0744977905_546FDR_N0430000SRLC00743_0000LMJ01. In (b)–(d), inner white circles denote the nominal locations of the outer diameter of the Coring Bit (27 mm) during drilling. Outer white circles denote the nominal locations of the outer diameter of the Coring Bit plus twice the 3σ lateral drill placement uncertainty. The latter is typically radially ±5.4 mm as in (b), (d) but occasionally ±9.4 mm as in (c), giving a total diameter of 37.8 mm or 45.8 mm, respectively.
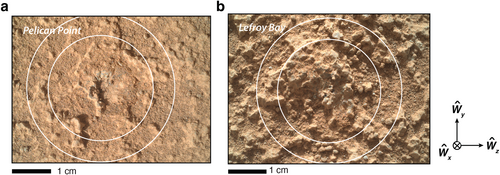
Wide Angle Topographic Sensor for Operations and eNgineering (WATSON) images of drilling targets on the Jezero margin with locations of cores noted. (a) Pelican Point (imaged on sol 920). WATSON image SIF_0920_0748623272_632FDR_N0450000SRLC00737_0000LUJ01. (b) Lefroy Bay (imaged on sol 938). WATSON image SIF_0938_0750226087_000FDR_N0460000SRLC00748_0000LMJ01. Inner white circles denote the nominal locations of the outer diameter of the Coring Bit (27 mm) during drilling. Outer white circles denote the nominal locations of the outer diameter of the Coring Bit plus twice the 3σ lateral drill placement uncertainty. For these cores, the latter is radially ±5.4 mm.
Equation 3 shows that the roll is a function of two quantities, here expressed in the Site frame. The first is the fiducial direction, the upward direction in the WATSON image, . The second is the projection of the direction of steepest ascent in the Drill plane, , into the WATSON plane: . Note that we have found that in practice, the Drill pointing vector and the WATSON pointing vector have been canted with respect to one another by angles ranging from 0.2 to 38° depending on the core.
Translation of the direction in the WATSON image to the core after it is returned to Earth requires identification of azimuthally asymmetric features on the core top. These rotationally asymmetrical features on the natural core top including nodules or bumps, crevices, and other markings that will be easily recognizable.
For cores lacking such natural markings, rotationally asymmetric artificial markings can be made on the core top using the laser on the SuperCam instrument (Maurice et al., 2021; Wiens et al., 2021). In particular, we have developed a procedure in which three distinct pits are produced on the outcrop surface prior to drilling in the shape of an “L” (∼2.5 mm × ∼1 mm) using 125 laser pulses lasting 4 ns each. The number of pits and their arrangement were chosen to meet four competing priorities. The first priority, addressed by maximizing the number of pits, is that the core surface must be successfully marked despite the typical lateral uncertainty in placement of the Drill. The second priority, addressed by maximizing the depth of each pit, is that the outside surface of the core must retain the marks until it is returned to Earth given the possibility that it could be damaged during or after drilling. The third and fourth priorities, addressed by minimizing both the number of pits and their depths, were to minimize laser damage to the core surface area and core volume and to reduce rover operational complexity and power consumption.
2.5.3 Propagating Orientation Into Core Body
The above description of the core orientation procedure assumes the core is returned to Earth as a solid object that is not internally differentially rotated during or after drilling. Because the only constraint on the state of internal deformation following drilling are from CacheCam images of the core bottom, the overall mechanical states of the drilled cores will be essentially unknown until they are returned to Earth. In fact, coring of a diversity of rock lithologies using the Mars 2020 Qualification Model Dirty Testing (QMDT) testbed at the Jet Propulsion Laboratory (JPL) found that essentially all cores fractured during drilling (see Figure 48 of Moeller et al. (2021)). Well-indurated lithologies with weak foliation (e.g., basalts, basaltic sandstones, and rhyolitic tuffs) typically produced fragments with well-preserved fracture planes (Figure 11). However, softer and more foliated lithologies (e.g., mudstones, hydrated sulfates) commonly produced fragments in the form of wafers or occasionally even pulverized pebbles and granules (Figure 11).
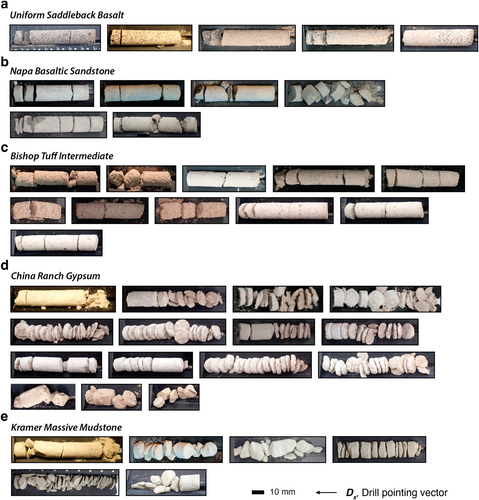
Results of coring attempts with the Mars 2020 Qualification Model Dirty Testing (QMDT) testbed at Jet Propulsion Laboratory (JPL). Shown are five different lithologies in order of decreasing compressive strength. (a) Five samples of the Uniform Saddleback Basalt, a massive aphanitic or very fine-grained to finely ophitic olivine basalt from the Early Miocene Tropico Group collected near Boron, CA (Dibblee Jr, 1958; Moeller et al., 2021; Peters et al., 2008). (b) Six samples of the Napa Basaltic Sandstone, a volcanogenic basaltic sandstone from the Early Cretaceous to Late Jurassic mélange of the Great Valley Sequence collected at the intersection of Capell Valley Road and Monticello Road in Napa, CA (Delattre & Sowers, 2006; Moeller et al., 2021). (c) Eleven samples of the Bishop Tuff Intermediate, a hypocrystalline rhyolitic pyroclastic rock from the Pleistocene Bishop Tuff, collected in northern Owens Valley, CA (Moeller et al., 2021; Wilson & Hildreth, 1997). (d) Fifteen samples of China Ranch Gypsum, a hydrated sulfate with massive, layered and vein occurrences from the Tertiary China Ranch Beds collected along China Ranch Road near Tecopa, CA (Hillhouse, 1987; Moeller et al., 2021). (e) Six samples of the Kramer Massive Mudstone, a sandy-silty clay provided by U.S. Borax, Kern County, CA (Moeller et al., 2021; Siefke, 1991).
For fragmented cores, the full core orientation (hade, azimuth, and roll) can be propagated into the core from the outer surface imaged by WATSON by rotating the fragments so that they fit together and lock into place like puzzle pieces. Computerized tomography scanning of the core in the sample receiving laboratory prior to extraction (e.g., Ziegler et al., 2021) would be very valuable for documenting the orientation relationships of fragments. The first depth at which pieces cannot be reassembled in this way to their original orientations sets the maximum depth to which the full orientation can be propagated using surface images. This maximum depth is highly dependent on core lithology; images of QMDT test cores show that it ranges from ∼20% to 100% of the core length for the indurated lithologies and ∼0%–40% for the soft and foliated lithologies (Figure 10). It is possible that other features (e.g., layering in the core i.e., not parallel to the core plane) could be used to orient core fragments beyond the maximum depth of propagation achieved with surface images.
2.6 Uncertainties on Core Orientations
We have identified two possible sources of uncertainty in the orientation of the Drill and WATSON: uncertainty in knowledge of the orientation of the Drill and WATSON in the Site frame and wobbling of the Drill during drilling. Although there may be additional uncertainty associated with reorienting the samples after return to Earth, it is currently not possible to quantify this because the sample receiving facility and its procedures are still under development. We discuss each below and then estimate the total uncertainty.
2.6.1 Uncertainties From Orientation Knowledge of the Drill and WATSON
The dominant source of uncertainty in orienting the cores is from uncertainty in the knowledge of the orientations of the Drill and WATSON in the Site frame. This has two contributions. First, there is uncertainty in the knowledge of the Rover Mechanical frame with respect to the Site frame, ϵbll (which quantifies errors in Qbll). This contributes to uncertainties in the hade, ∆Hbll, azimuth, ∆Abll and roll, ∆αbll. Second, both the Drill and WATSON orientation knowledge uncertainty have contributions from uncertainties in the orientation of these tools relative to the Rover Mechanical frame, ϵDb, and ϵWb (which quantify uncertainties in QDb and QWb, respectively). The Drill orientation knowledge uncertainty ϵDb in turn contributes to uncertainties in the hade, ∆HDb and azimuth, ∆ADb, while the WATSON orientation knowledge uncertainty ϵWb contributes to the roll, ∆αWb.
We first consider uncertainty in orientation knowledge of the Rover Mechanical frame in Site frame coordinates. During routine operations, attitude knowledge of Perseverance is required to remain below a critical threshold of 3.5° (3σ) for the rover to be able to accurately point its antenna toward Earth for communications. However, as introduced above, the uncertainty in the rover attitude increases linearly with increased driving distance and when the 3.5° threshold is reached, the rover must perform a SAPP update. Immediately after the SAPP update, the uncertainty in the rover orientation is ϵbll = 0.881° (3σ) (Estlin, 2020).
| Uncertainty term | All but Otis Peak (°) | Otis Peak (°) |
|---|---|---|
| ϵbll | 0.881 | 0.881 |
| ϵSU | 0 | <0.141a |
| ∆Hbll | 0.509 | <0.590b |
| ∆HDb | <0.810 | <0.810 |
| ∆Ho | <0.031 | <0.031 |
| ∆H | 0.957 | 1.003 |
| ∆Abll | 0.509 | <0.590b |
| ∆ADb | <0.810 | <0.810 |
| ∆Ao | <0.680 | <0.680 |
| ∆A | 1.174 | 1.211 |
| ∆αbll | 0.509 | <0.590b |
| ∆αWb | <2.060 | <2.060 |
| ∆α | <2.122 | <2.143 |
| Total | <2.607 | <2.658 |
- Note. The first column lists term in the uncertainty budget, value for all cores except Otis Peak (3σ), and the third column lists the value for Otis Peak (3σ). The uncertainties are estimated as discussed in Section 2.6.
- a Estimated using a delay since last sunID update of ∆t = 10 min.
- b Assumes that the uncertainty in rover orientation following the last sunID update is evenly apportioned between the hade, ∆Hbll, azimuth, ∆Abll, and roll, ∆αbll In fact, the sunID update mainly improves the yaw uncertainty, which in general is not equally apportioned to the uncertainty in hade, azimuth, and roll. We ignore this complication because of the very small magnitudes of ϵSU.
2.6.2 Wobbling of Drill During Drilling
A minor contribution to the uncertainty comes from temporal changes in the orientation of the Drill relative to the outcrop due to wobbles during drilling. As a result, the cylindrical axes of different sections along the length of the core will have slightly different orientations. In the worst-case scenario that the rock being drilled is perfectly deformable, the temporal variation in the direction of core pointing vector, ϵo, would contribute to uncertainties in the hade, ∆Ho and azimuth, ∆Ao. However, our analysis of drill wobble in Section 3.2 shows that the average (3σ) variations are trivial: for the hade, ∆Ho < 0.031° and for the azimuth, ∆Ao < 0.68° (Table 3).
2.6.3 Total Orientation Uncertainty
3 Application to Perseverance Cores
3.1 Summary of Acquired Samples
We determined the orientations for the 20 successful rock cores as well as for the unsuccessful Roubion core. Because the regolith sampling process does not maintain the relative orientations of the acquired grains during sample acquisition (Moeller et al., 2021), we did not attempt to orient their sampling tubes.
3.2 Estimation of Wobbling of Drill
We also estimated the variation of the orientation of the Drill during drilling (see Section 2.6.2). For the first 12 rock cores, we estimated these variations using a comparison of the Drill orientation just after loading the Stabilizers and just prior to commencing drilling versus just after the end of drilling and before unloading the Stabilizers. In all cases, we found that the changes in the hades and azimuths were <0.2° and 0.08°, respectively. For the remaining 8 rock cores, these variations were estimated from these two timesteps along with 20–30 intermediate timesteps, each of which is associated with the acquisition of a Front Hazcam (e.g., Figure 4) image. From the latter metadata, we found that the 3σ variations in the hades and azimuths are only 0.031° and 0.68°, respectfully, across the 8 cores (Figure 12; Movies S1–S8). Because the latter estimates are based on more measurements than the 2-point calculations from the first 12 cores, we report the latter estimates in Table 3.
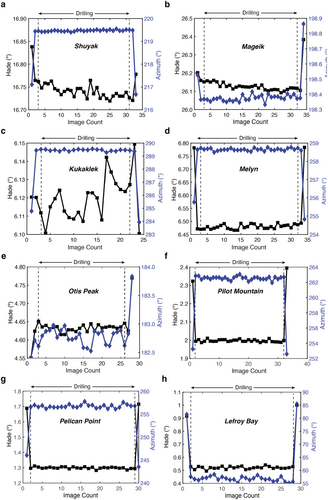
Variations in the orientation of the Drill during drilling. Shown are hade (black squares, left axis) and azimuth (blue diamonds, right axis) of Drill approximately every minute during the coring activities. First point is prior to loading of Stabilizers, second point is after loading of Stabilizers but just prior to commencing drilling, the second to last point is after drilling but before unloading of the Stabilizers, the last point is after unloading the Stabilizers. All intermediate points (labeled “Drilling” between and including points marked with dashed lines) are during drilling. (a) Shuyak (drilled on sol 575). See Movie S2 for images taken at the same time as these metadata. (b) Mageik (drilled on sol 579). See Movie S3 for images taken at the same time as these metadata. (c) Kukaklek (drilled on sol 623). See Movie S4 for images taken at the same time as these metadata. (d) Melyn (drilled on sol 749). See Movies S1a and S1b for images taken at the same time as these metadata. (e) Otis Peak (drilled on sol 822). See Movie S5 for images taken at the same time as these metadata. (f) Pilot Mountain (drilled on sol 882). See Movie S6 for images taken at the same time as these metadata. (g) Pelican Point (drilled on sol 923). See Movie S7 for images taken at the same time as these metadata. (h) Lefroy Bay (drilled on sol 942). See Movie S8 for images taken at the same time as these metadata. The largest changes in the orientations occur during the loading and unloading of the Drill. During coring, the orientation of the Drill changes by <0.1° for all cores.
3.3 Core Orientations
The orientations for the first 20 rock cores taken with the Perseverance rover are shown in Table 1. Annotated WATSON images for each of the rock cores denoting the estimated rolls and directions toward Martian geographic north relative to the coring surfaces are shown for the crater floor (Figure 13), fan front (Figure 14), upper fan (Figure 15), and margin (Figure 16) separately. We found that the natural outcrop surfaces of most coring targets had durable asymmetric markings that could be used for core orientation (Figures 7, 8, and 9c). However, we concluded that the outcrop targeted for 2 cores—Bearwallow and Melyn—lacked such natural markings and so we marked them using SuperCam prior to drilling (Figures 8, 9, and 9b). In addition, the mission baselined SuperCam core top marking for all cores from Pelican Point onward to minimize operational complexity.
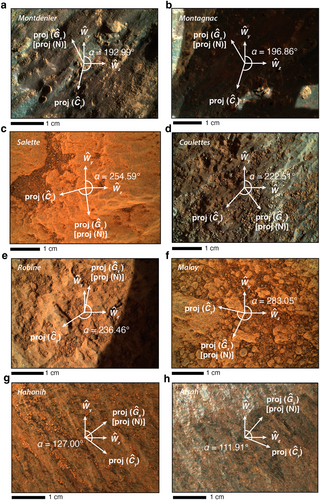
Wide Angle Topographic Sensor for Operations and eNgineering (WATSON) images showing roll orientation for Perseverance rock cores from the Jezero crater floor. The image plane is defined by the WATSON y- and z-axes, (−). The roll, α, is defined as the clockwise angle from to the projection of the core y-axis, onto the WATSON image plane. Also shown is the projection of Geographic north (i.e., projection of ) onto the WATSON image plane. (a) Montdenier. WATSON image SIF_0188_0683643364_351FDR_N0070000SRLC00678_0000LMJ01. (b) Montagnac. WATSON image SIF_0195_0684255577_390FDR_N0070000SRLC00701_0000LMJ01. (c) Salette. WATSON image SIF_0257_0689756802_085FDR_N0080000SRLC00654_0000LUJ01. (d) Coulettes. WATSON image SIF_0267_0690661712_886FDR_N0080000SRLC00701_0000LMJ01. (e) Robine. WATSON image SIF_0293_0692957683_398FDR_N0090000SRLC00643_0000LMJ02. (f) Malay. WATSON image SIF_0337_0696859111_167FDR_N0090276SRLC00636_0000LMJ01. (g) Hahonih. WATSON image SIF_0370_0699795188_894RAS_N0110108SRLC00663_0000LMJ01. (h) Atsah. WATSON image SIF_0373_0700065505_402RAS_N0110108SRLC00657_0000LMJ01.
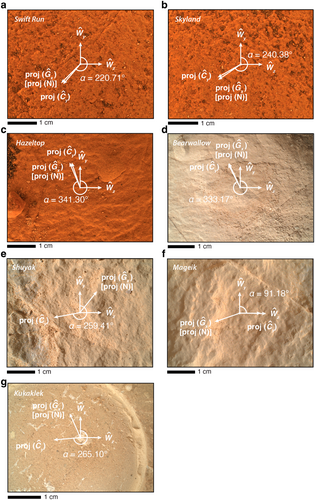
Wide Angle Topographic Sensor for Operations and eNgineering (WATSON) images showing roll orientation for Perseverance rock cores from the Jezero fan front. The image plane is defined by the WATSON y- and z-axes, (−). The roll, α, is defined as the clockwise angle from to the projection of the core y-axis, onto the WATSON image plane. Also shown is the projection of Geographic north (i.e., projection of ) onto the WATSON image plane. (a) Swift Run. WATSON image SIF_0485_0709994755_121FDR_N0261004SRLC00730_0000LMJ01. (b) Skyland. WATSON image SIF_0485_0709996024_867FDR_N0261004SRLC00730_0000LMJ01. (c) Hazeltop. WATSON image SIF_0505_0711773216_015RAS_N0261222SRLC00730_0000LMJ01. (d) Bearwallow. WATSON image SIF_0511_0712314955_726FDR_N0261222SRLC00773_0000LMJ01. (e) Shuyak. WATSON image SIF_0570_0717551784_765FDR_N0290000SRLC00750_0000LMJ01. (f) Mageik. WATSON image SIF_0577_0718170754_562FDR_N0290000SRLC00701_0000LMJ01. (g) Kukaklek. WATSON image SIF_0614_0721455441_734FDR_N0301172SRLC00643_0000LMJ01.
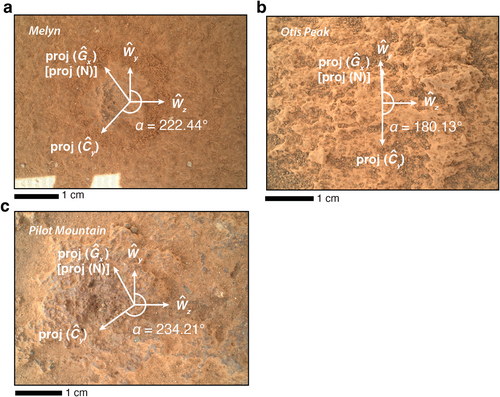
Wide Angle Topographic Sensor for Operations and eNgineering (WATSON) images showing roll orientation for Perseverance rock cores from the Jezero upper fan. The image plane is defined by the WATSON y- and z-axes, (−). The roll, α, is defined as the clockwise angle from to the projection of the core y-axis, onto the WATSON image plane. Also shown is the projection of Geographic north (i.e., projection of ) onto the WATSON image plane. (a) Melyn. WATSON image SIF_0747_0733259668_218FDR_N0370000SRLC00748_0000LMJ01. (b) Otis Peak. WATSON image SIF_0822_0739913201_500FDR_N0400132SRLC00660_0000LMJ0. (c) Pilot Mountain. WATSON image SIF_0879_0744977905_546FDR_N0430000SRLC00743_0000LMJ01.
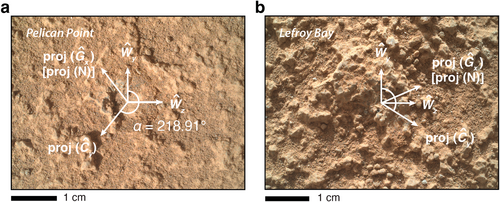
Wide Angle Topographic Sensor for Operations and eNgineering (WATSON) images showing roll orientation for Perseverance rock cores from the Jezero margin. The image plane is defined by the WATSON y- and z-axes, (−). The roll, α, is defined as the clockwise angle from to the projection of the core y-axis, onto the WATSON image plane. Also shown is the projection of Geographic north (i.e., projection of ) onto the WATSON image plane. (a) Pelican Point. WATSON image SIF_0920_0748623272_632FDR_N0450000SRLC00737_0000LUJ01. (b) Lefroy Bay. WATSON image SIF_0938_0750226087_000FDR_N0460000SRLC00748_0000LMJ01.
As a consistency check on the accuracy of our orientations, we expect that paired samples that are taken from the same outcrop will have similar hades and azimuths. However, we have no similar expectation for the roll as that angle is heavily dependent on the orientation of the WATSON camera rather than on the intrinsic relief of the outcrop. The average difference in hade between paired samples is 4.14°, while the average difference in azimuth is 7.98° excluding the Malay and Robine cores. The Malay and Robine cores, while taken from the same outcrop, were sampled with the rover on different sides of the outcrop leading to a 147.93° difference in their azimuths.
4 Implications for Sample Receiving Facility
To enable these orientation angles to be used for returned sample science analyses, the Sample Receiving Facility (Carrier et al., 2022) should develop procedures to document the relative orientations of core fragments in each sample tube. This could involve X-ray tomography and measuring the natural remanent magnetization of the sample tube before removing the sample and imaging the sample after removal to document petrofabrics and other potential orientation indicators. Furthermore, to enable recovery of the roll, the core top should be imaged for comparison relative to WATSON images.
5 Summary
The Mars 2020 project does not carry requirements to obtain orientation information for drill cores nor to acquire samples of bedrock. Following landing, we successfully advocated for the prioritization of bedrock samples wherever possible and developed and implemented a system for orienting rock cores to better than 2.7° (3σ) total uncertainty. Of the 20 rock cores successfully drilled by Perseverance so far, 18 were acquired from bedrock, meaning that directional data from these samples can be extrapolated to outcrop and potentially regional scale rocks. An uncertainty of 2.7° is comparable to or better than that typically achieved on Earth for 25-mm diameter shallow (<100 mm long) cores using handheld drills and exceeds that for deep (>1 m) drill cores. It is more than sufficient to achieve a diversity of paleomagnetic, sedimentological, igneous and tectonic returned sample science studies on the returned samples. These are the first oriented bedrock samples acquired from another planet. Procedures should be developed for the Sample Receiving Facility to enable these orientations to be transferred to subsamples allocated for returned sample science analyses.
Acknowledgments
We thank the full Mars 2020 team for the contributions to the development of the rover flight system and contributions to surface operations. B. P. W. and E. N. M. thanks the Mars 2020 Participating Scientist program (Grant 80NSSC20K0238) for funding and James Tanton for a providing us with a basic education about quaternions. Work at LANL and Purdue was funded by NASA contract NNH123ZDA018O. Some of this research was carried out at JPL, California Institute of Technology, under a contract with the National Aeronautics and Space Administration (80NM0018D0004).
Open Research
Data Availability Statement
All of the information and data newly presented in this contribution are available in the Planetary Data System (PDS) (https://pds-geosciences.wustl.edu/missions/mars2020/). Rover instrument and calibration details can be found in the instrument payload citations included in the primary text: Allwood et al. (2020), Bell et al. (2021), Bhartia et al. (2021), Maurice et al. (2021), and Wiens et al. (2021). A MATLAB code that calculates the core azimuth, hade and roll using rover housekeeping data is supplied with the Data Set S1 (Code S1) and archived on the Harvard Dataverse (https://doi-org.ezproxyberklee.flo.org/10.7910/DVN/FF5R3V).


